Cell Body Segmentation and Electrophysiology Data: Stellate Ganglion
Contents:
Overview
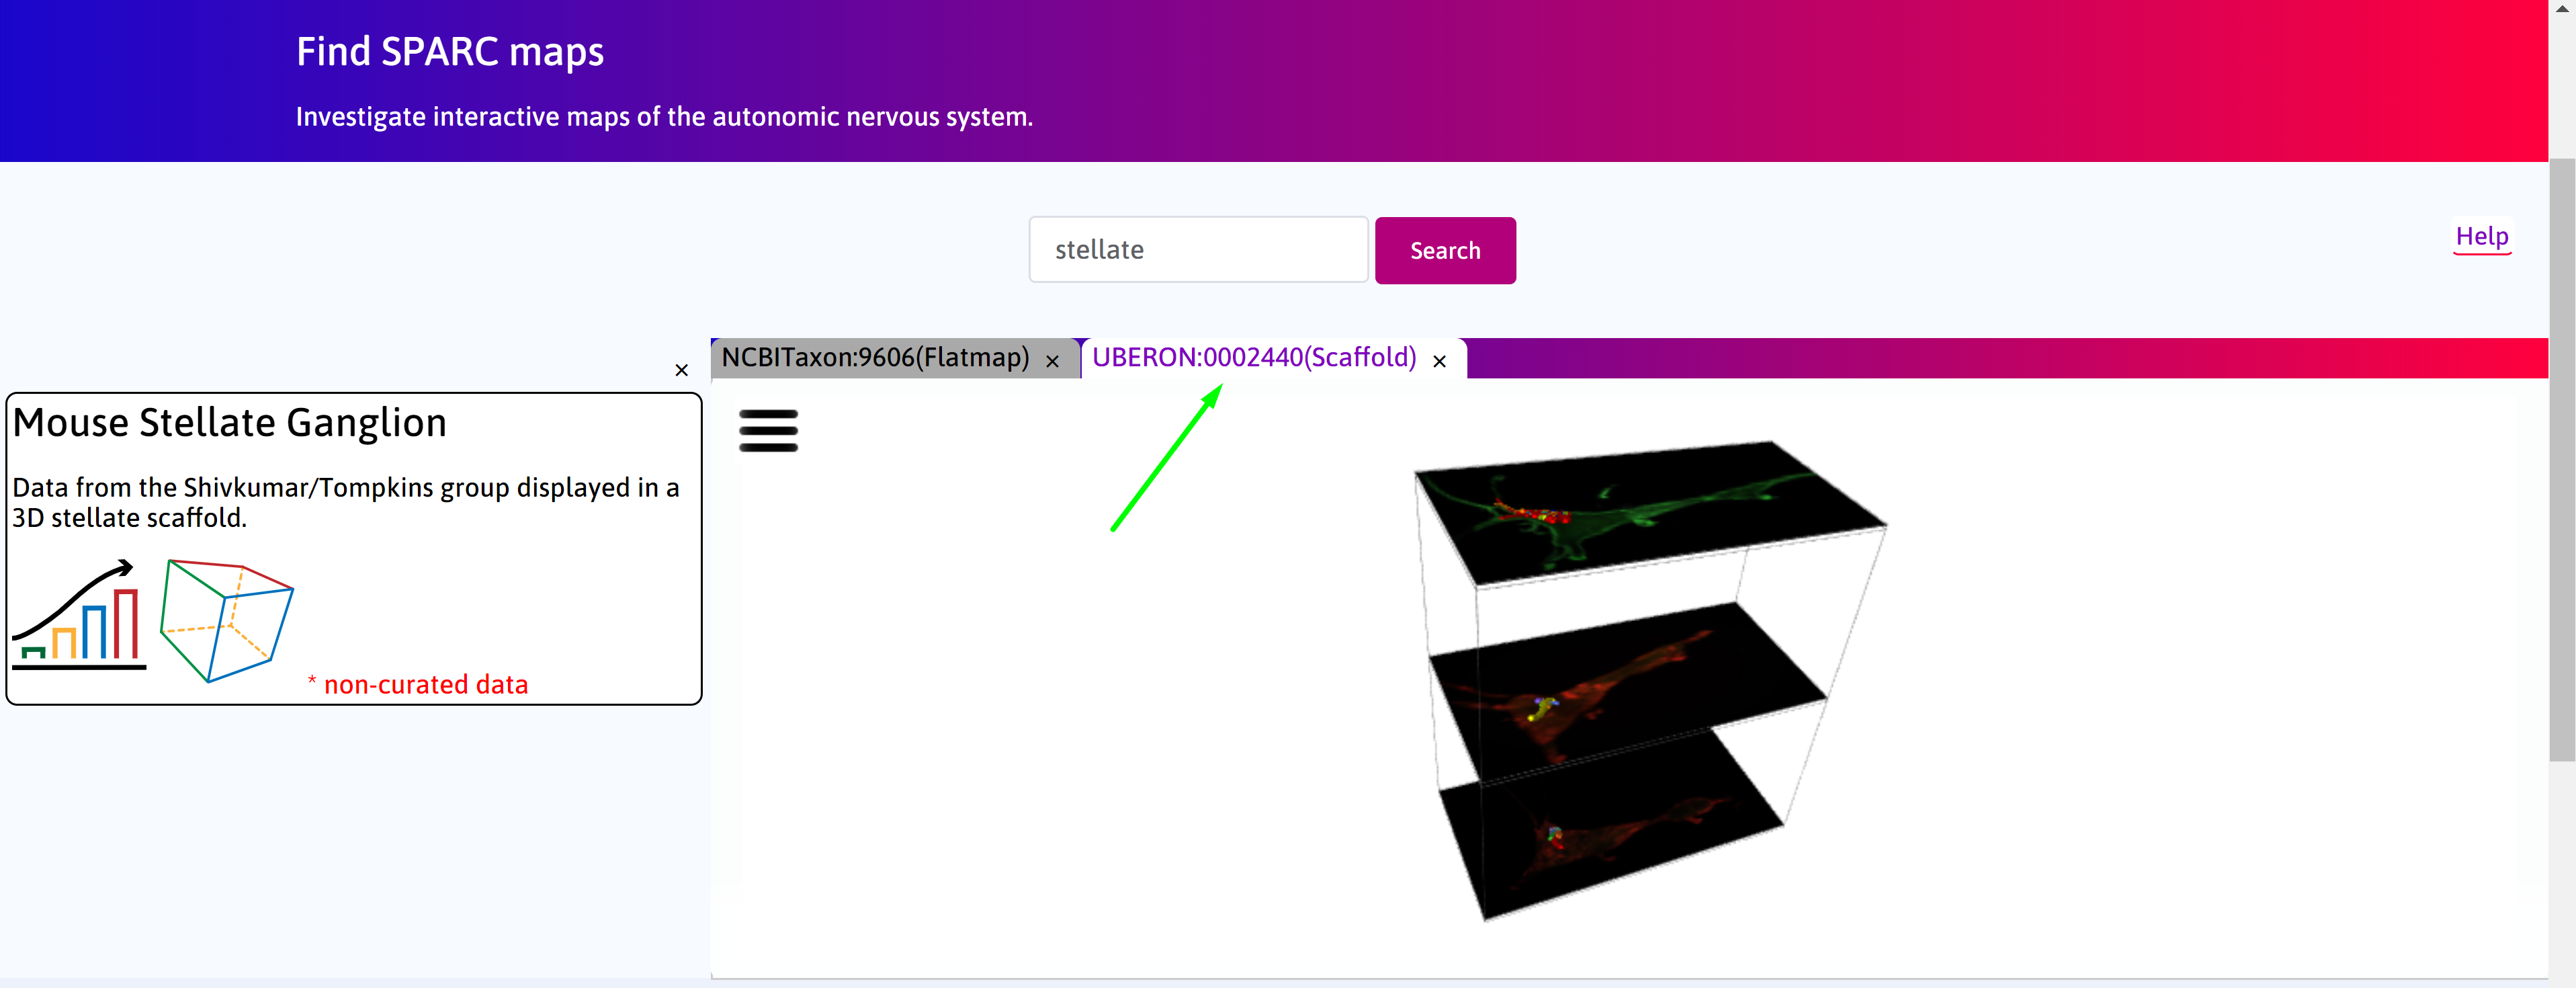
Mouse stellate ganglion neuronal cell shape data from the Shivkumar/Tompkins group are displayed in a 3D stellate scaffold. 15 neurons, including their cell bodies, axons and dendrites, are displayed on five cross-sections of the stellate with the high resolution image displayed as a texture map. Electrophysiological data from these cells can be visualized by clicking on the cell. Note that the scaffold in this example is a geometrically simple shape designed to register the images in the appropriate anatomical location. The shape of the scaffold will be improved once more data are available to define the stellate boundaries.
This document guides a user of the SPARC Data Portal through the steps required to discover a collection of segmented cell bodies from the stellate ganglion which have been mapped to a common coordinate framework for visualization purposes. The user is able to discover any electrophysiological data that has been recorded for each of the cell bodies.
Step-by-step instructions
Follow these step-by-step instructions to familiarise yourself with the flow of the web interface.
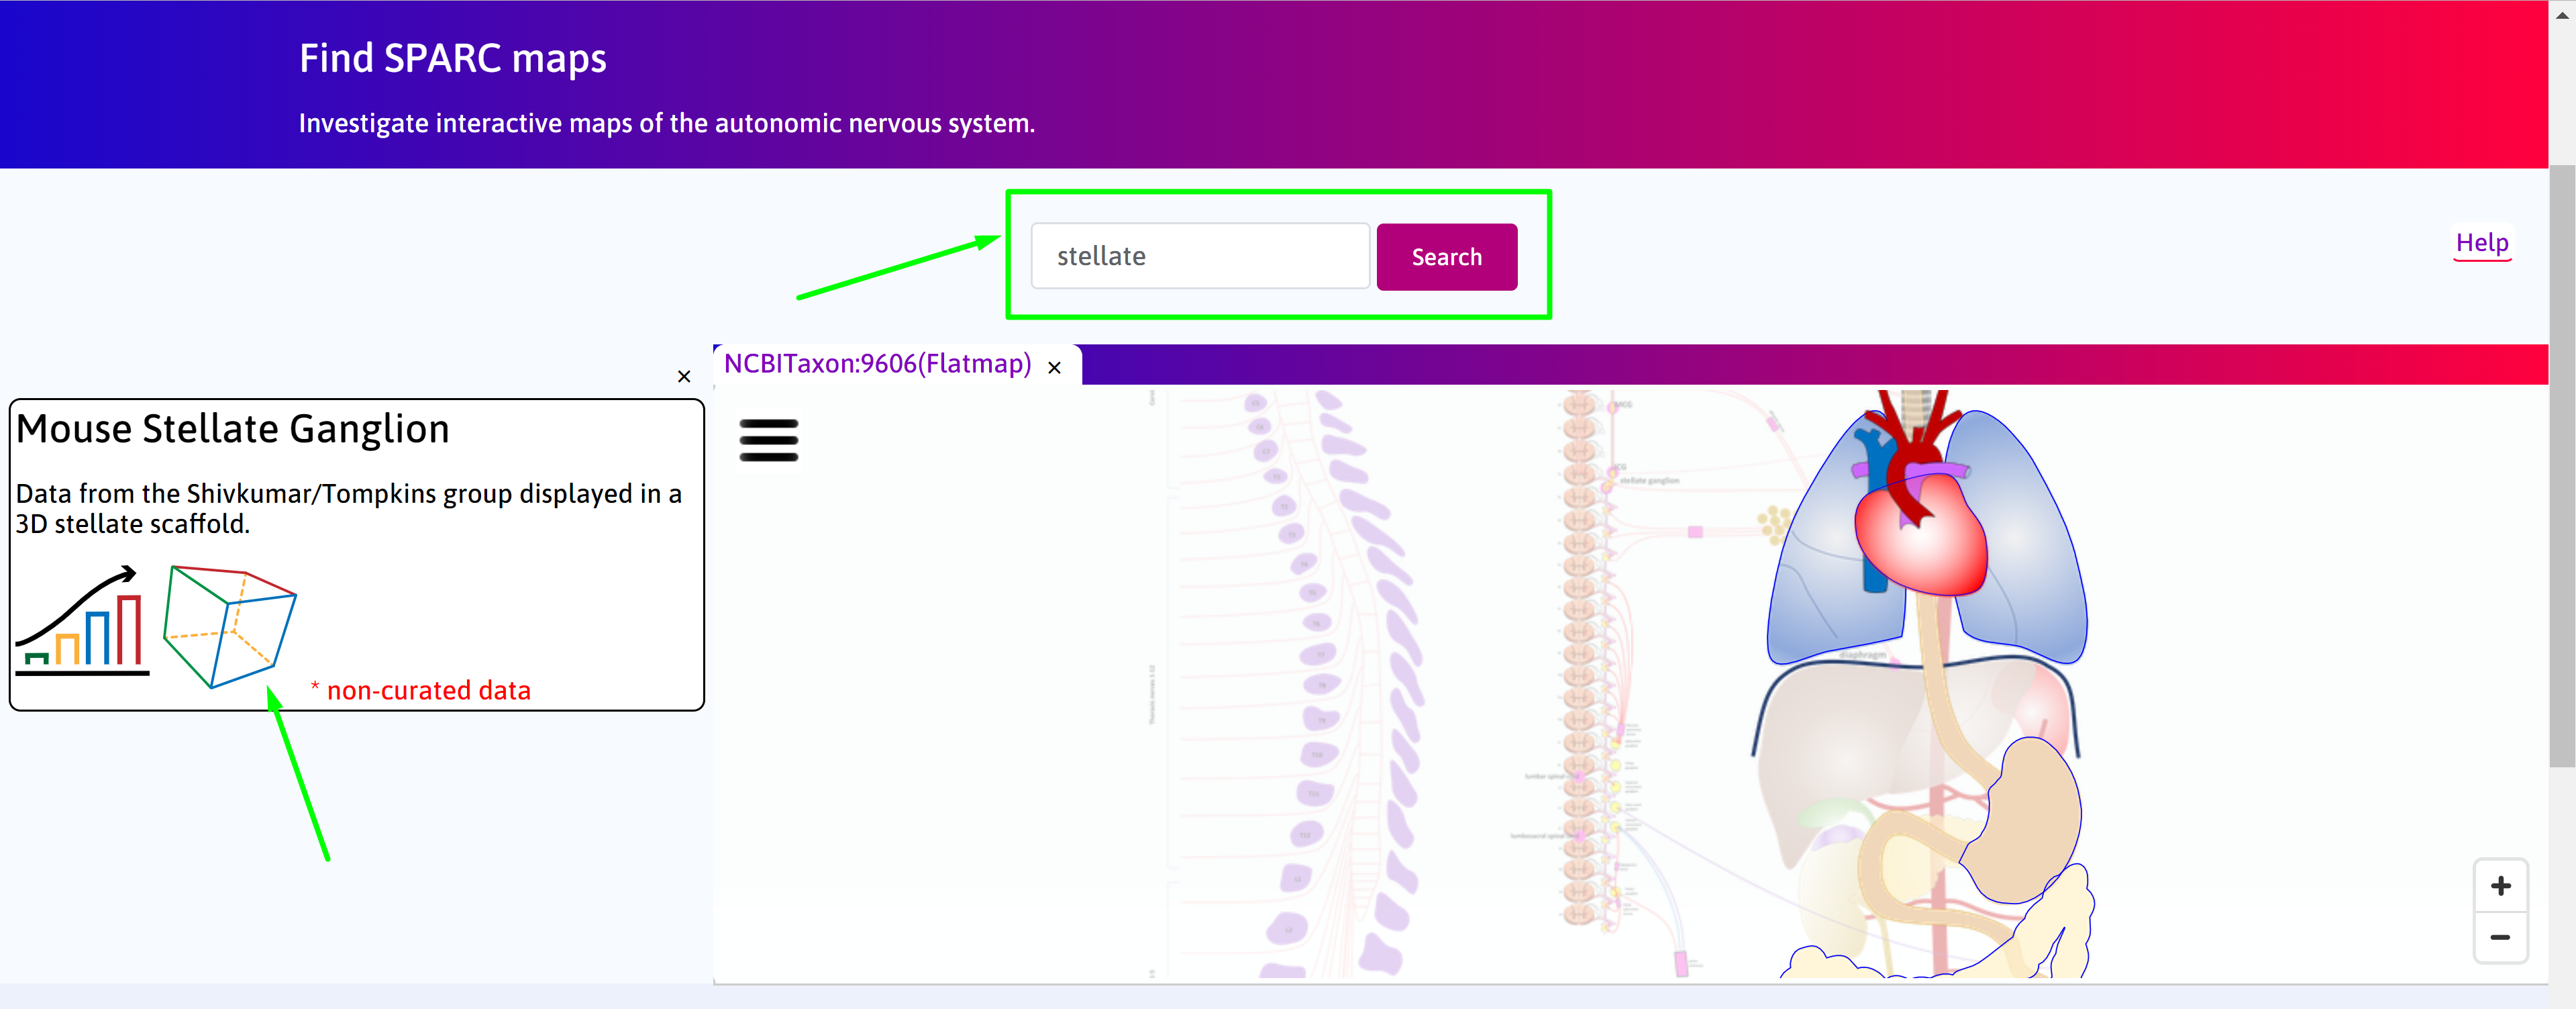
Step 1. Perform a search using keywords stellate or stellate ganglion and click on ![]() icon.
icon.
Step 1. The default Result column displays the use cases available on the portal. Click on the Cell Body Segmentation and Electrophysiology Data: Stellate Ganglion box.
Step 2. A new tab called Scaffold Viewer will open to display the anatomical organ scaffold of the stellate. The current scaffold is a rectangular cube with slots to contain the stellate image stacks using texture mapping techniques within the scaffold elements. Segmented cells (soma) with associated axon and dendrites have been mapped and embedded in the image-scaffold structure. Each cell will have electrophysiological data properly registered.
Step 3. Click on ![]() icon on the search result to visualise the electrophysiological data associated with the samples.
icon on the search result to visualise the electrophysiological data associated with the samples.
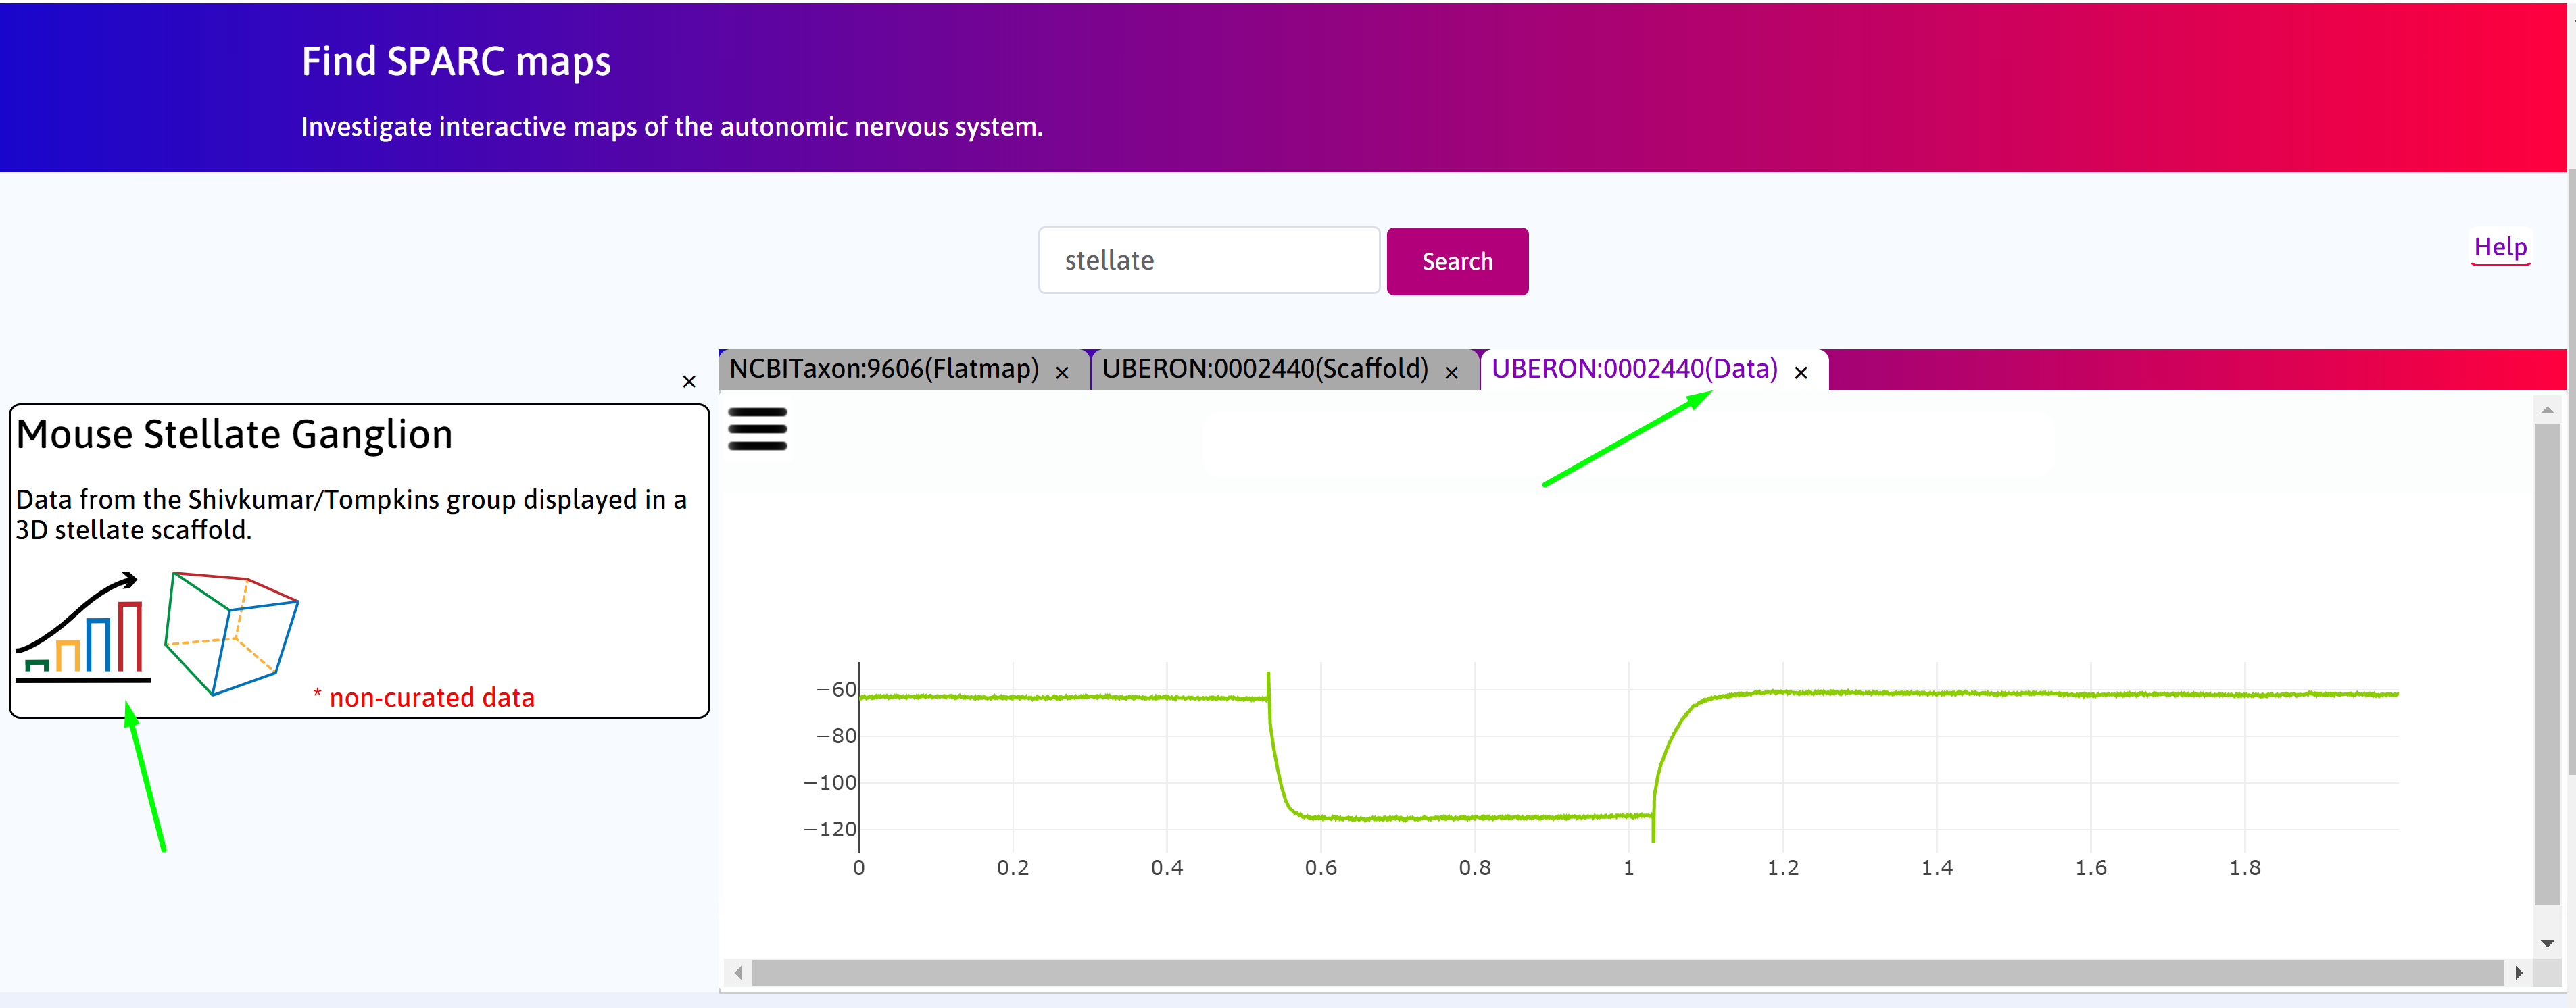
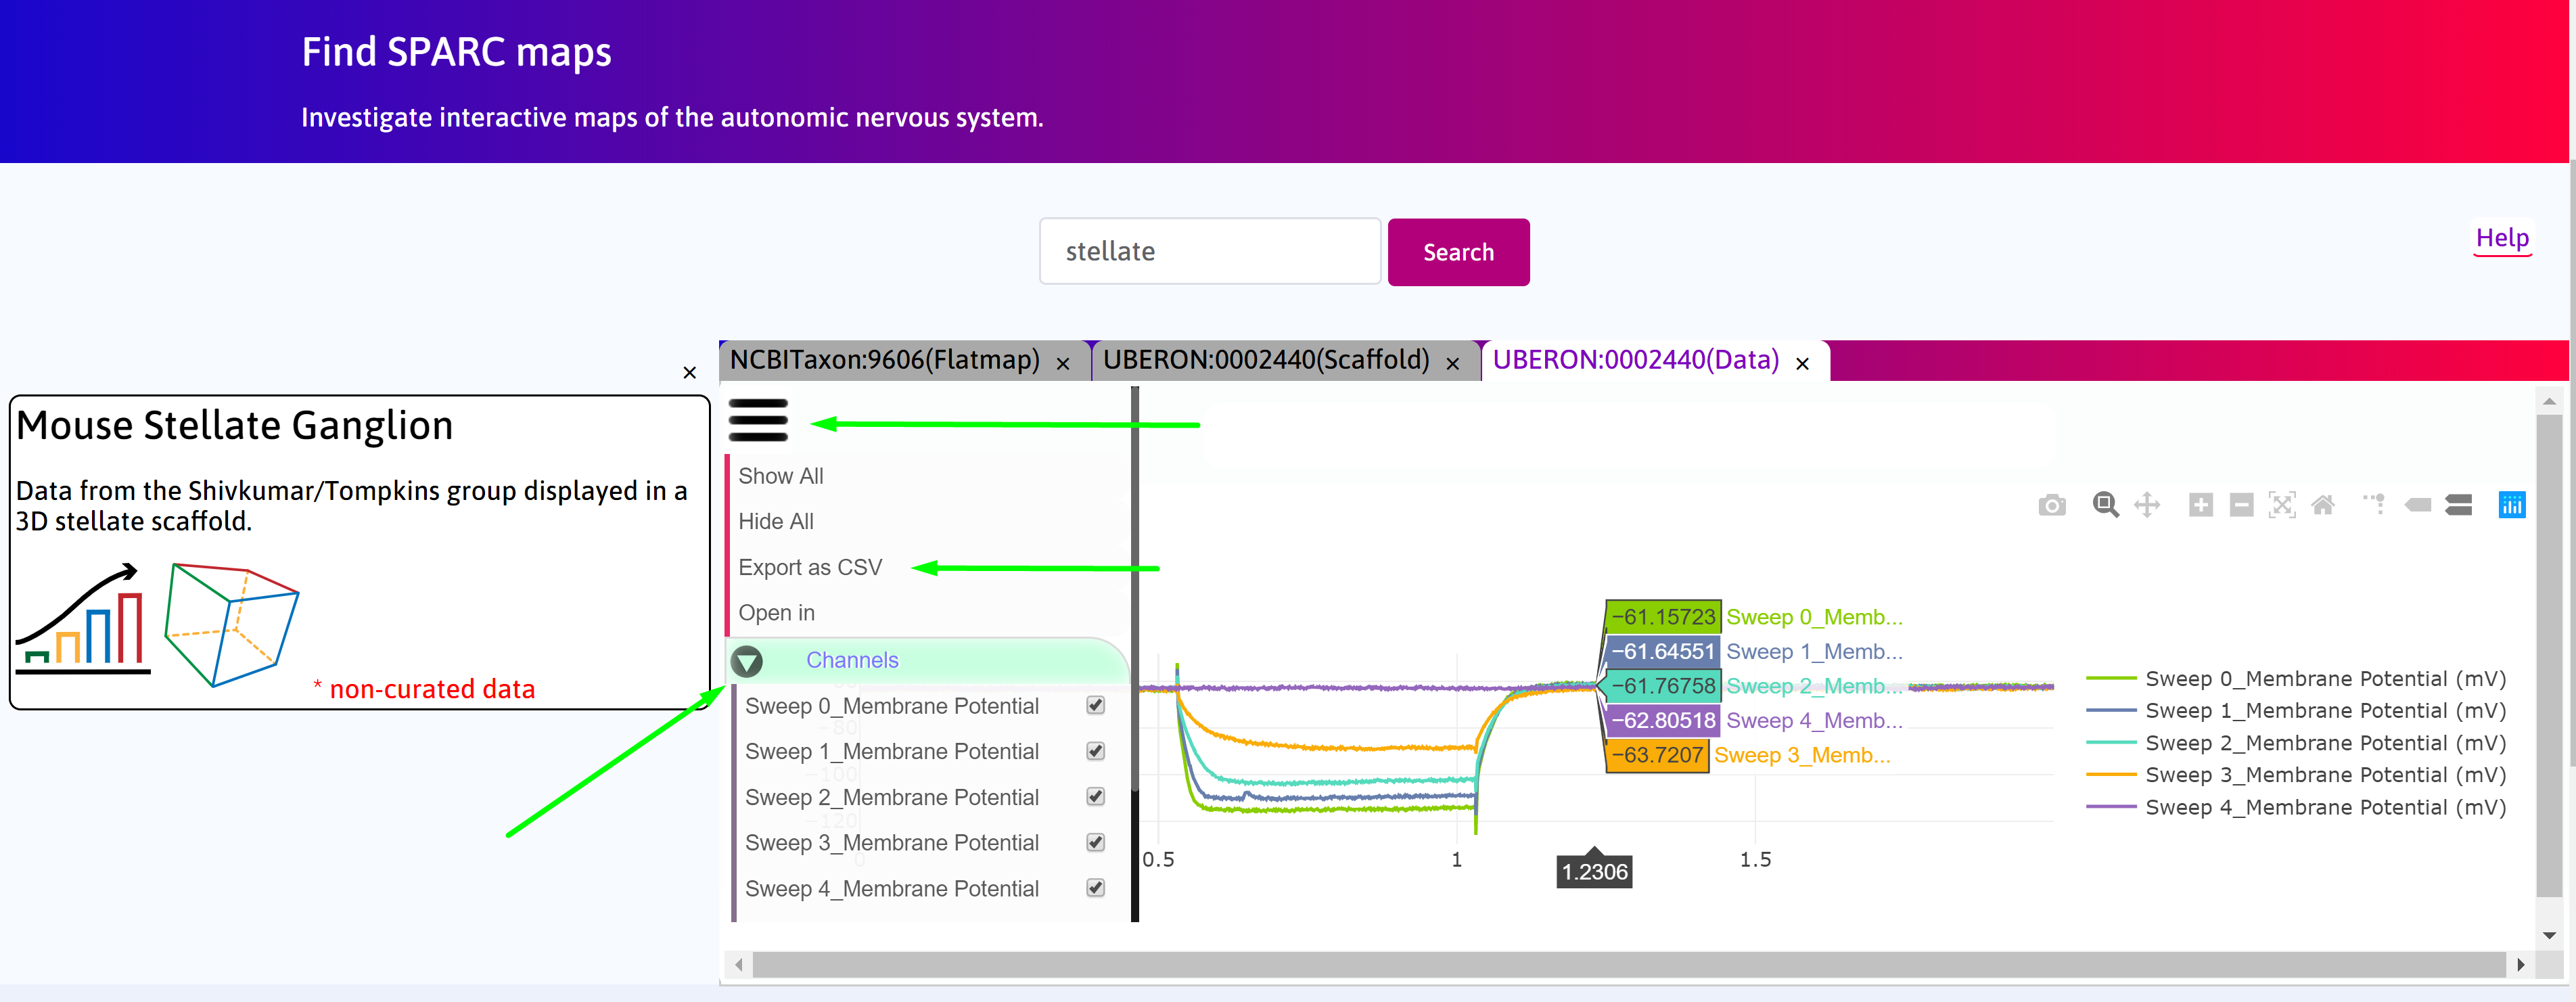
Step 4. Click on  to open the control panel. You can select different sweep or channel data for that cell in this tab to visualise both simultaneously.
You can also export the data as a CSV format file.
to open the control panel. You can select different sweep or channel data for that cell in this tab to visualise both simultaneously.
You can also export the data as a CSV format file.