 Data Viewer
A module of the data portal designed for viewing and exporting Ephys and Genome data.
Contents:
Overview
This document describes how to use the data plotting viewer tool available on the SPARC Data Portal. Examples of this tool in action are available at https://data-viewer-demo.netlify.com/.
This module has the ability to:
- Plot electrophysiological CSV datasets in the knowledgbase or Blackfynn.
- Plot genome and other static CSV datasests.
- Navigate large datasets via the user interface.
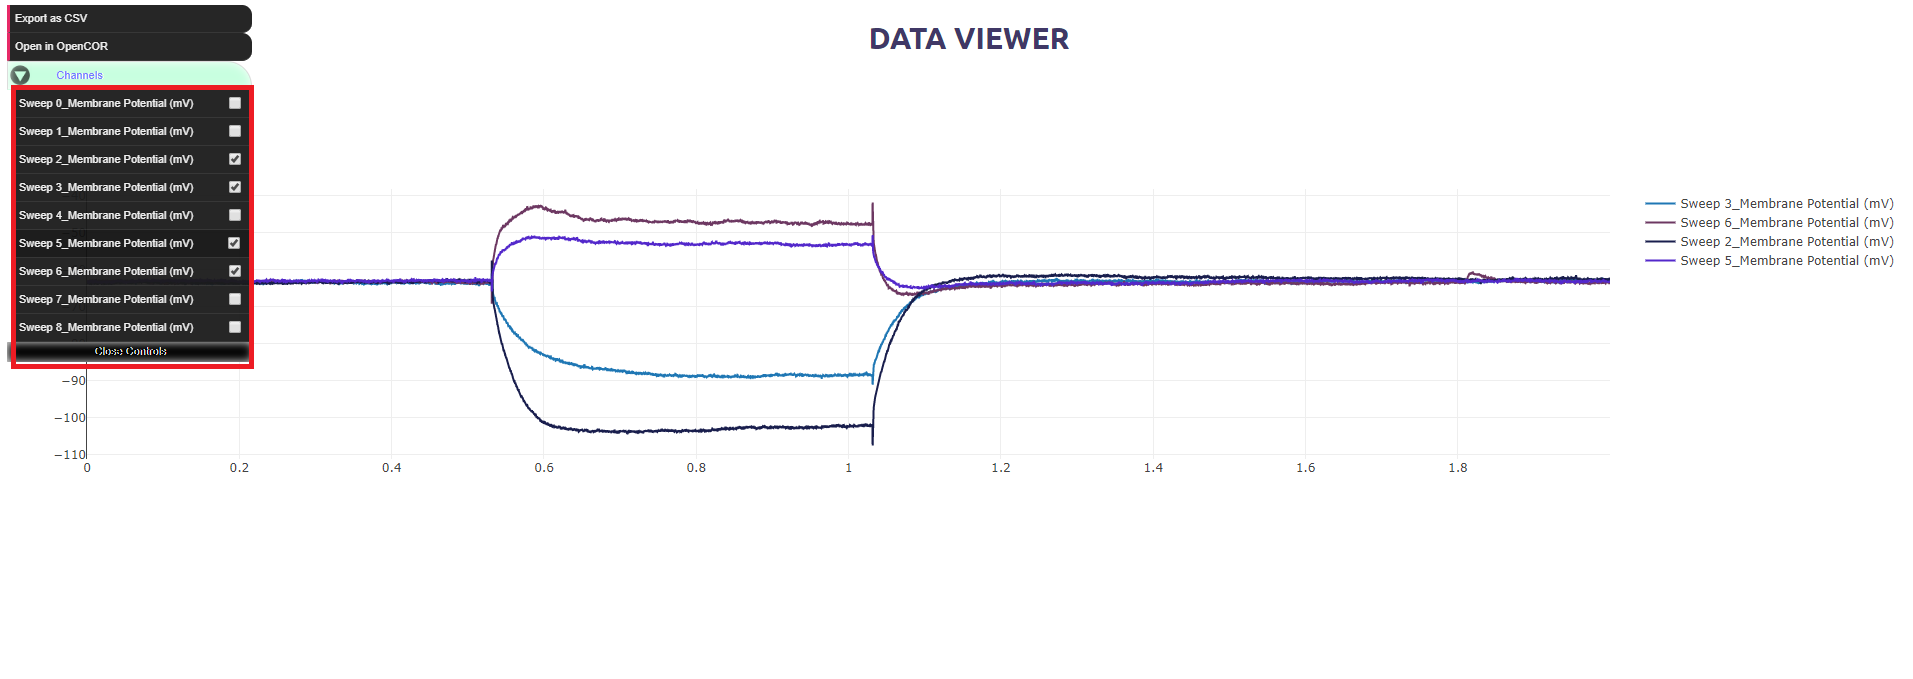
- Add and remove channels from a plot and export them.
- Export selected channels as CSV for use in Excel or OpenCOR.
Viewer Configuration
The viewer has two modes, for small and large datasests.
Small Datasets
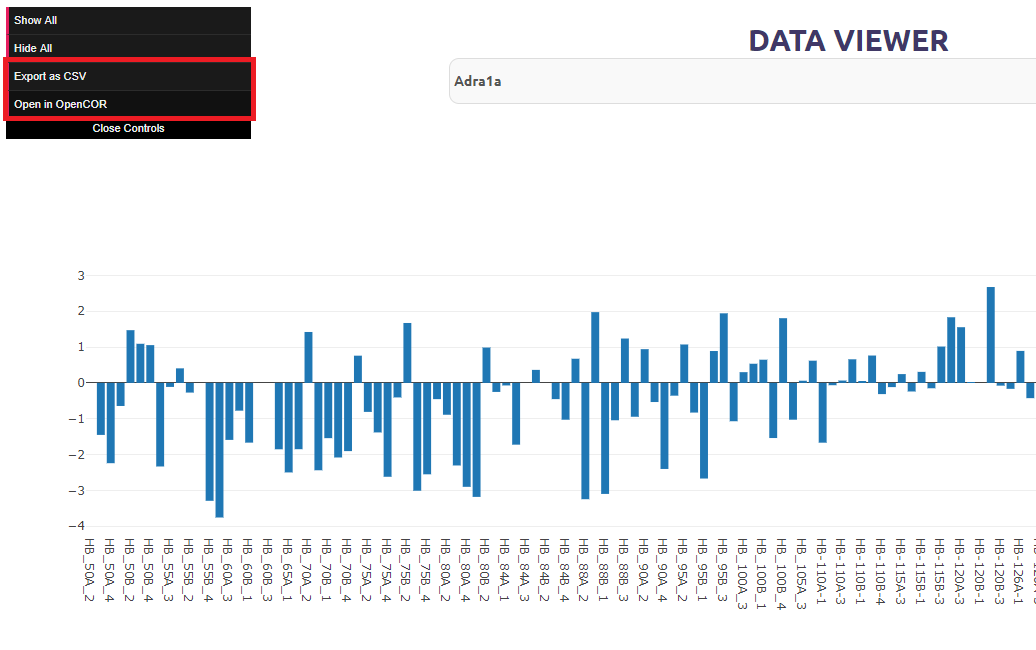
This mode is used for smaller datasets and has more control over exports. (All checked channels will be exported.)
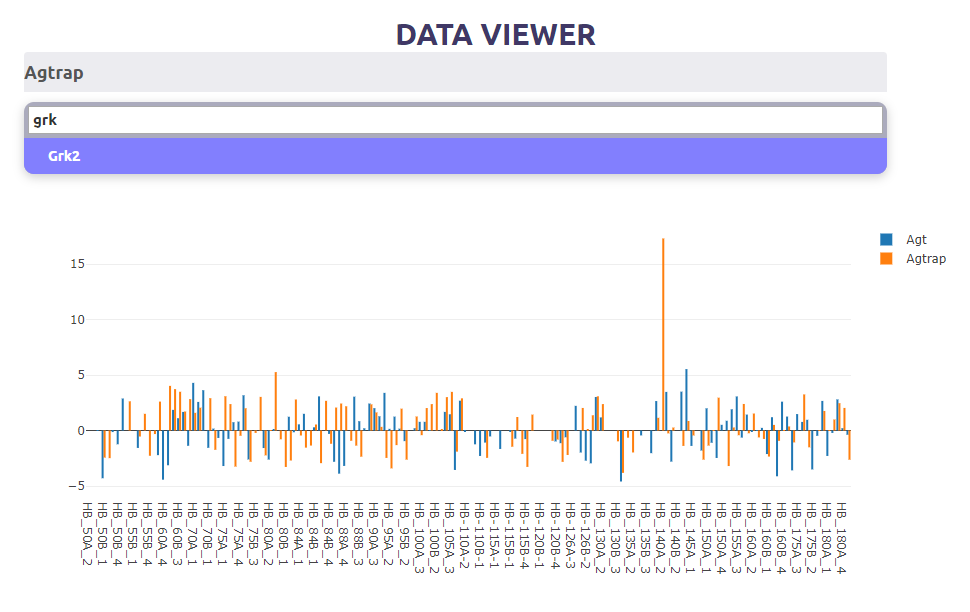
Large Datasets
This mode is used to navigate larger datasets. It has search capability to plot the desired channels.
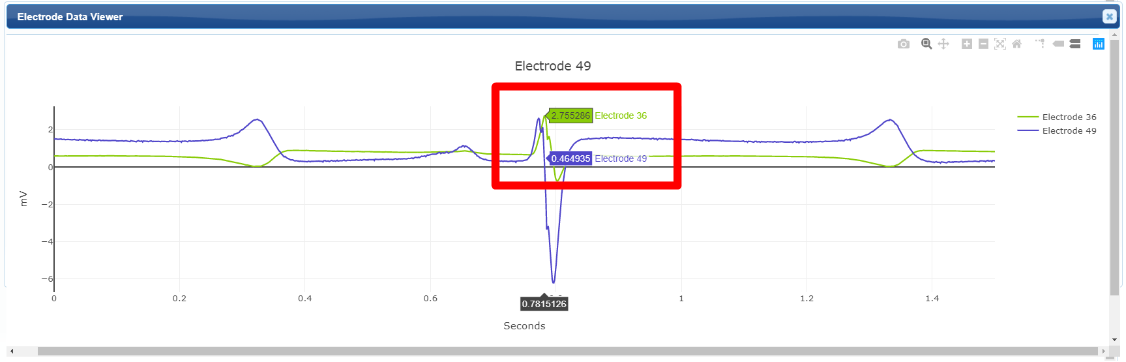
Interactive Graphics Controls
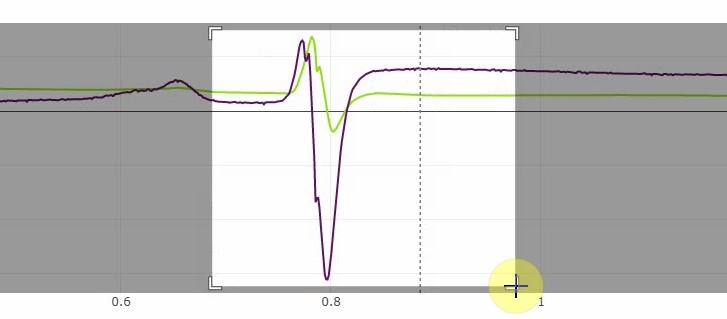
You can refine the view by dragging over a region of interest.
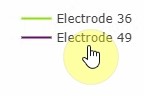
You can also add or remove data by clicking on its label.
The table below describes the effect of different user actions in the flatmap being displayed.
| Mouse action | Result |
|---|---|
left-click |
Zoom in via box selection |
middle-click |
Zoom in via box selection |
double-click |
Reset the view |
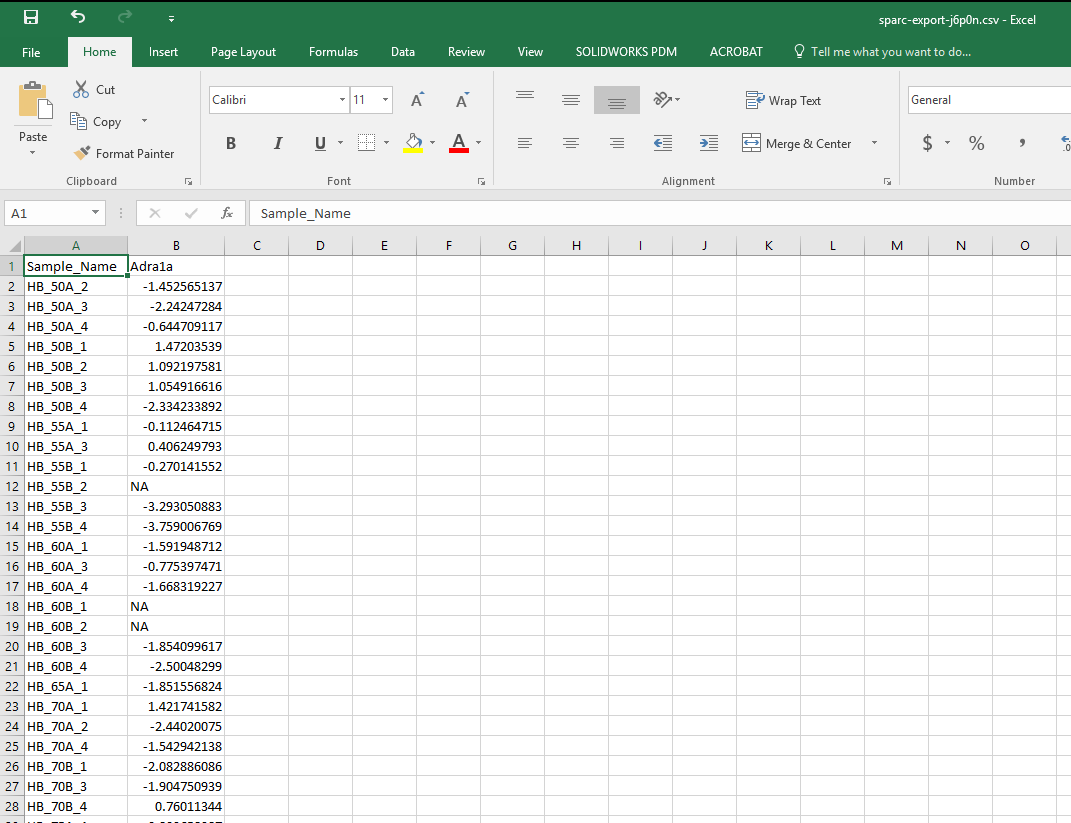
CSV (Comma-Separated Values) Exports
The selected data traces plotted are exported to a CSV file for use in Excel, OpenCOR or any CSV-capable software.